matplotlib入门基础(五)轴坐标范围 轴刻度比例 轴刻度 |
您所在的位置:网站首页 › matplotlib 设置坐标范围 › matplotlib入门基础(五)轴坐标范围 轴刻度比例 轴刻度 |
matplotlib入门基础(五)轴坐标范围 轴刻度比例 轴刻度
|
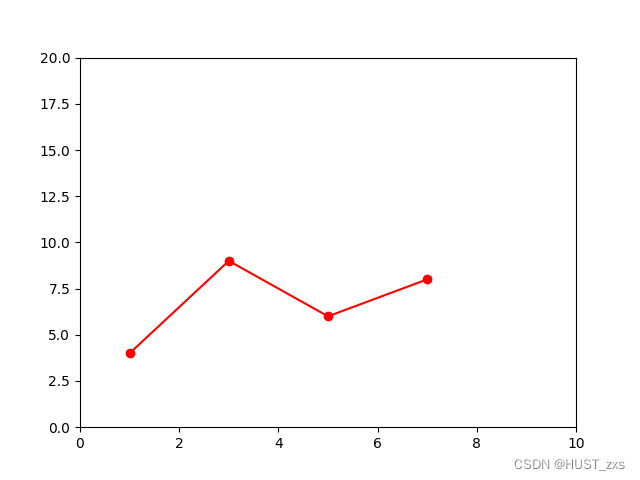
这篇文章同样以面向对象风格为主,介绍设置轴坐标范围、轴刻度比例、轴刻度(xtick,ytick)的方法。 这篇文章分以下部分来介绍: 1. 设置轴坐标范围 2. 设置轴刻度比例 3. 设置轴刻度 1. 设置轴坐标范围 仍然使用面向对象风格,创建figure,创建axes,用axes画图,再调用axes模块里的函数,贴出一段基础代码 import matplotlib.pyplot as plt x = [1,3,5,7] y = [4,9,6,8] # 创建figure,axes,并用axes画图 figure = plt.figure() axes = figure.add_subplot(1,1,1) axes.plot(x,y,'o-r') # x轴数值范围 # 其他参数参考官网 axes.set_xlim(left=0, right=10) # y轴数值范围 # 其他参数参考官网 axes.set_ylim(bottom=0, top=20) plt.show()axes.set_xlim()和axes.set_ylim()只设置前两项参数,参数含义明显。其余参数参考官网。 (axes.set_xlim()函数完整参数参考官网:matplotlib.axes.Axes.set_xlim — Matplotlib 3.5.2 documentation axes.set_ylim()函数完整参数参考官网:matplotlib.axes.Axes.set_ylim — Matplotlib 3.5.2 documentation) 执行可以得到以下图片
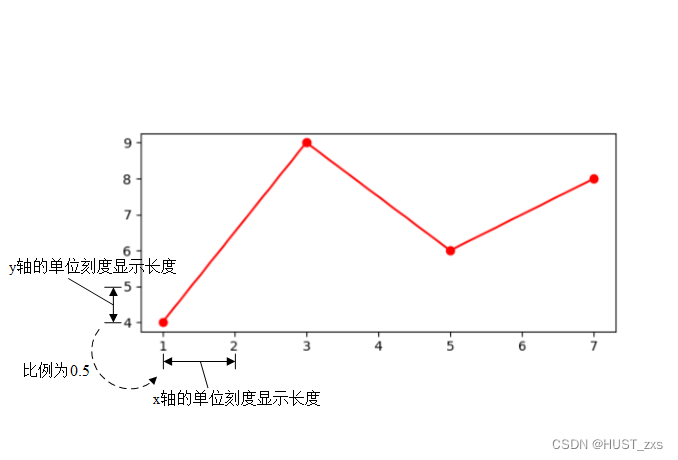
同样,就设置轴数值范围来说,上面的一段代码等效于(pyplot风格) # pyplot函数用法 plt.xlim(...) plt.ylim(...) 2. 设置轴刻度比例 仍然使用面向对象风格,创建figure,创建axes,用axes画图,再调用axes模块里的函数,贴出一段基础代码 import matplotlib.pyplot as plt x = [1,3,5,7] y = [4,9,6,8] # 创建figure,axes,并用axes画图 figure = plt.figure() axes = figure.add_subplot(1,1,1) axes.plot(x,y,'o-r') # y轴的单位刻度显示长度 与 x轴的单位刻度显示长度 的比例 # 其他参数参考官网 axes.set_aspect(aspect=0.5) plt.show()axes.set_aspect()只设置第一项参数aspect,表示 y轴的单位刻度显示长度 是 x轴的单位刻度显示长度 的aspect倍。其余参数参考官网。 (axes.set_aspect()函数完整参数参考官网:matplotlib.axes.Axes.set_aspect — Matplotlib 3.5.2 documentation) 执行可以得到以下图片,图中已经注释所设置的参数对应的效果
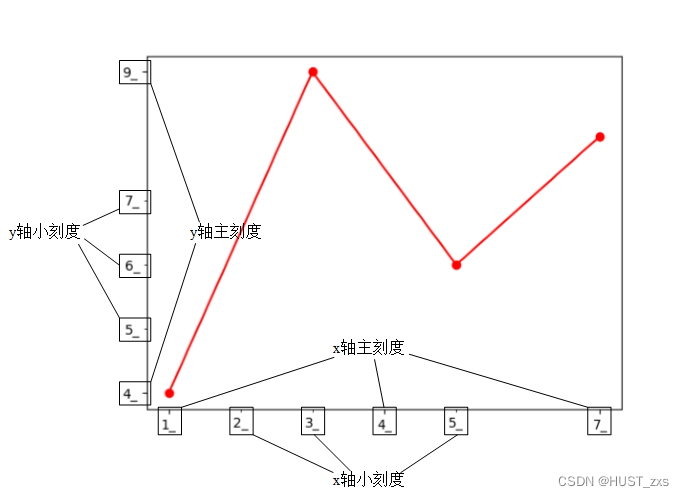
如果要设置y轴和x轴的单位刻度显示长度相同,还可以用axes.axis('equal')等方式,这里省略介绍。 3. 设置轴刻度 轴刻度(tick)包含轴刻度的定位(locator)和轴刻度的格式化显示(formatter)两部分,实际使用时一般还会分成主刻度(major)和小刻度(minor)分别设置,设置较复杂,这里只给出最简单的FixedLocator和FixedFormatter的示例。 仍然使用面向对象风格,创建figure,创建axes,用axes画图,再调用axes模块里的函数,贴出一段基础代码 import matplotlib.pyplot as plt import matplotlib.ticker as ticker x = [1,3,5,7] y = [4,9,6,8] # 创建figure,axes,并用axes画图 figure = plt.figure() axes = figure.add_subplot(1,1,1) axes.plot(x,y,'o-r') # x轴主刻度的位置和样式 axes.xaxis.set_major_locator(ticker.FixedLocator([1,4,7])) axes.xaxis.set_major_formatter(ticker.FixedFormatter(['1_','4_','7_'])) # x轴小刻度的位置和样式 axes.xaxis.set_minor_locator(ticker.FixedLocator([2,3,5])) axes.xaxis.set_minor_formatter(ticker.FixedFormatter(['2_','3_','5_'])) # y轴主刻度的位置和样式 axes.yaxis.set_major_locator(ticker.FixedLocator([4,9])) axes.yaxis.set_major_formatter(ticker.FixedFormatter(['4_','9_'])) # y轴小刻度的位置和样式 axes.yaxis.set_minor_locator(ticker.FixedLocator([5,6,7])) axes.yaxis.set_minor_formatter(ticker.FixedFormatter(['5_','6_','7_'])) plt.show()axes.xaxis.set_major_locator()表示在axes的x轴上设置主刻度的定位,函数的参数为FixedLocator对象,FixedLocator([1,4,7])表示在1、4、7的位置设置刻度。axes.xaxis.set_major_formatter()表示在axes的x轴上设置主刻度的格式化显示,函数的参数为FixedFormatter对象,FixedFormatter(['1_','4_','7_'])表示显示的字符串为'1_'、'4_'、'7_'。 其余函数的含义类似。 (axis.set_major_locator()函数参考官网:matplotlib.axis.Axis.set_major_locator — Matplotlib 3.5.2 documentation axis.set_major_formatter()函数参考官网:matplotlib.axis.Axis.set_major_formatter — Matplotlib 3.5.2 documentation axis.set_minor_locator()函数参考官网:matplotlib.axis.Axis.set_minor_locator — Matplotlib 3.5.2 documentation axis.set_minor_formatter()函数参考官网:matplotlib.axis.Axis.set_minor_formatter — Matplotlib 3.5.2 documentation) 执行可以得到以下图片,图中已经注释x轴主刻度,x轴小刻度,y轴主刻度,y轴小刻度
可以观察到主刻度比小刻度的显示长度略长一点点,这可以帮助分辨主刻度和小刻度。 轴刻度可以参考:matplotlib.ticker — Matplotlib 3.5.2 documentation 轴刻度的定位的显示效果可以参考:Tick locators — Matplotlib 3.5.2 documentation 轴刻度的格式化显示的显示效果可以参考:Tick formatters — Matplotlib 3.5.2 documentation 设置刻度还有其他方式,例如axes.set_xticks()等函数,但函数功能与这里介绍的设置定位(locator)和格式化显示(formatter)的方法不完全相同,这里省略介绍。 |
【本文地址】
今日新闻 |
推荐新闻 |